Introduction
[ Best AI Tools for Data Analysis ] What AI tools can help us understand data better and learn more from it? There is so much data out there these days that it can be hard to figure it all out.
But new AI technologies are coming out that are meant to make data analysis easier. AI tools are automating many parts of the analysis process.
For example, machine learning algorithms find patterns and natural language processing systems summarize what was found.
But now that there are so many choices, how do we know which ones are the best to put into action? Choosing the right tools for high growth at the start can save analytics teams time and work in the long run.
What is AI Data Analysis?
AI data analysis refers to the use of AI techniques and algorithms to process, understand, and derive useful insights from sizable and intricate data sets.
To automate analysis, find patterns, and make predictions or classifications, it makes use of machine learning, deep learning, and other AI technologies.
AI-based data analysis helps businesses get useful information from huge amounts of data more quickly and correctly.
How to Use AI for Data Analysis?
Here are the five unique ways to use AI tools for data analysis :
- Generate code: AI can write code for jobs like data cleaning, feature engineering, and model training that are used in data analysis. This can help make the results of data analysis more accurate and save data analysts a lot of time and work.
- Explain insights: AI can be used to describe the data-based insights that are found. This could be useful for data analysts who want to know why certain trends show up in the data.
- Create synthetic data: AI can be used to make synthetic data, which is data that a computer program makes. This could be helpful for data analysts who want to use a big set of data to test their models without having to gather the data themselves.
- Create dashboards and reports: Dashboards and reports that are constantly updated with the latest data can be made with AI. This can help make sure that everyone is always up to date on the latest data and save a lot of time and work for data analysts.
- Automate data entry: Data cleaning and validation are two examples of jobs that AI can be used to automate. This can help make the results of data analysis more accurate and save data analysts a lot of time and work.
How to Choose Right AI Tools For Data Analysis?
While choosing the right AI tools for data analysis, you need to look at a number of factors to get best AI Tools for your business needs:
✅ Define Your Goals. The goal of your data analysis is to reach what? What do you want to learn from this? You can begin selecting the appropriate AI tools and techniques for your project once you have determined your objectives.
✅ Gather your data: The data you want to analyze will need to be gathered. This information could come from many places, like databases, files, or social media.
✅ Clean and prepare your data: This is a crucial step in any data analysis job. To do this, mistakes must be fixed, outliers must be found, and data must be normalized.
✅ Choose the right AI tools and techniques: Depending on the project’s goals and the type of data you are looking at, the best option will vary.
✅ Train your AI model: To use your data, you will need to train your AI model after picking out the AI tools and techniques. This is the process of telling your AI model to find patterns and guess what will happen next.
✅ Evaluate your results: Evaluate your results after training your AI model. This means testing how well your model can find trends and guess what will happen next.
✅ Deploy your model: You can put your AI model into production once you are happy with how it looks and works. In order to analyze new data and make predictions, you can now use your model.
🫴 Explore The Top AI Tools For High Quality Leads and Growth 🫴
List Of Best AI Tools For Data Analysis
If you want to quickly analyze data, here are some of the best AI tools you can use:
1️⃣ Tableau
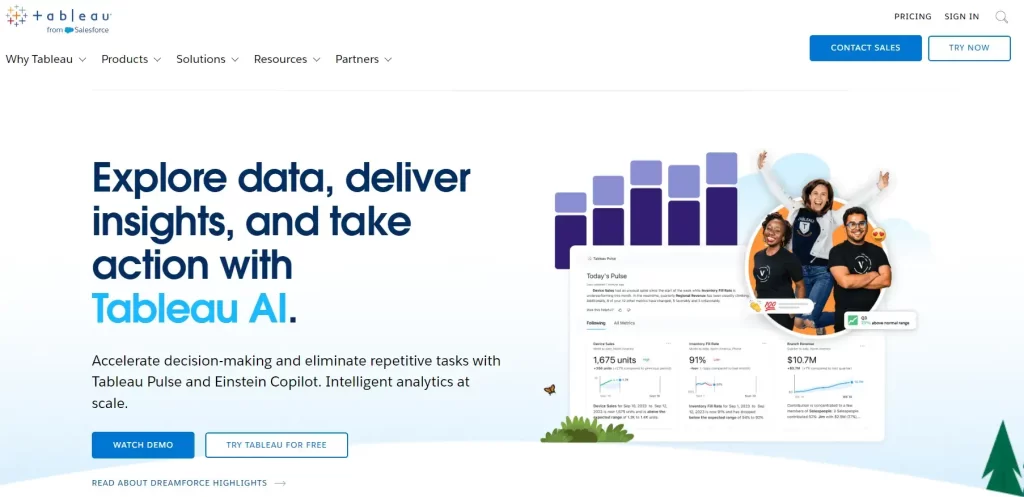
Tableau is one of the most popular AI tools for business intelligence and data visualization. More than 90,000 companies use it.
Tableau’s drag-and-drop system makes it easy for anyone to look at data and see what it means, even if they don’t know how to code.
Features of Tableau
- Easy-to-use and dynamic dashboards for telling stories with data
- Help with real-time data
- There are many ways to show data, such as charts, graphs, maps, and more.
- Putting together data from different sources
- Different ways to prepare and clean data
- Can be reached from a computer or the web
Limitations of Tableau
- Advanced statistical analysis and machine learning capabilities lacking compared to R or Python
- Mostly meant for data visualization rather than a full predictive analytics platform
- Higher pricing compared to some alternative BI tools
Tableau Pricing
| Plan | Per User/Month | Features |
|---|---|---|
| Tableau Creator | $75 | Every deployment requires at least one Creator. Includes Tableau Desktop, Tableau Prep, and a Creator license of either Tableau Server or Tableau Online |
| Tableau Explorer | $42 | Explore trusted data and answer your own questions faster with full self-service analytics. Includes one Explorer license of Tableau Server |
| Tableau Viewer | $15 | View and interact with dashboards and visualizations in a secure, easy-to-use platform |
2️⃣ Microsoft Power BI
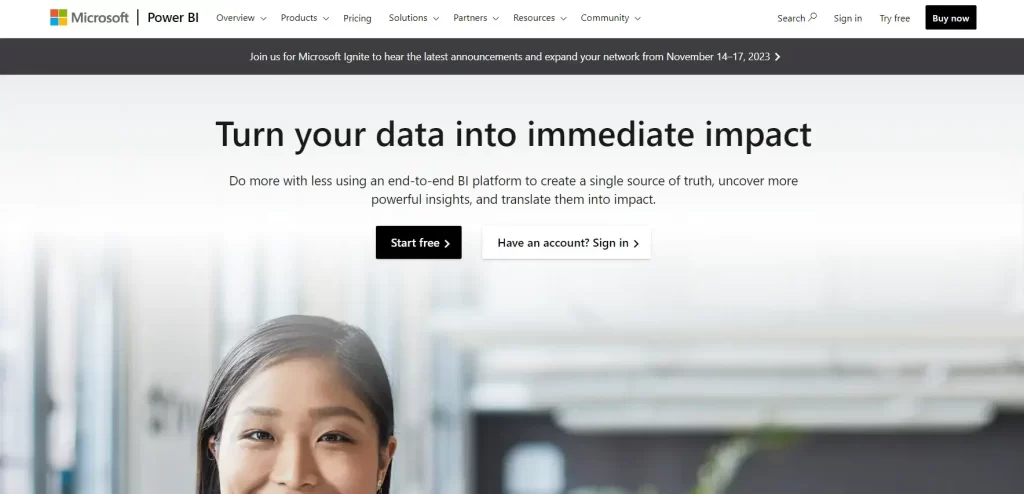
Microsoft Power BI is a business analytics tool that comes with Office 365 licenses.
Power BI makes it simple for anyone to visualize and analyze data with interactive dashboards and insights powered by AI.
Features of Power BI
- user-friendly drag-and-drop interface for making dashboards and results quickly
- Using natural language, automated AI ideas emerged.
- Streaming data in real time for advanced analytics
- Numerous visualization choices, including unique visuals
- Multiple price levels, from free to premium
Limitations of Power BI
- user-friendly drag-and-drop interface for making dashboards and results quickly
- Using natural language, automated AI ideas emerged.
- Streaming data in real time for advanced analytics
- Numerous visualization choices, including unique visuals
- Multiple price levels, from free to premium
Microsoft Power BI Pricing
| Plan | Price | Features |
|---|---|---|
| Power BI in Microsoft Fabric free account | Free | Create reports with Power BI Desktop, Publish Power BI reports to share and collaborate |
| Power BI Pro | $15 per user/month | Create reports with Power BI Desktop, Publish Power BI reports to share and collaborate, Advanced AI, dataflows, datamarts, and XMLA endpoint read/write |
| Power BI Premium per user | $29.90 per user/month | Create reports with Power BI Desktop, Publish Power BI reports to share and collaborate, Advanced AI, dataflows, datamarts, and XMLA endpoint read/write, All users can consume Power BI content without a paid per-user license |
| Power BI Premium per capacity (includes Microsoft Fabric) | $7,475.30/month | Create Power BI Desktop reports. Sharing and collaborating with Power BI reports Reading/writing XMLA endpoints, advanced AI, dataflows, datamarts, Anyone can use Power BI without a license. Access to Microsoft Fabric workloads like Data Factory, Engineering, Warehouse, Science, Real-Time Analytics, and Activator. |
3️⃣ IBM Watson Analytics
IBM Watson Analytics uses AI to turn data into useful information.
Watson Analytics aims to make analytics simple for all business users by automating pattern recognition, letting you ask questions in normal language, and storing data.
Features of Watson Analytics
- Automated suggestions for ideas and visualizations
- Support for asking questions about data in natural language
- Scalable cloud data warehouse already set up
- Templates and market models that are already made
- Works perfectly with other IBM Cloud Pak services
Limitations of Watson Analytics
- Needs to move data to the IBM cloud
- Customization is limited compared to analytics based on programming
- steep learning curve because of the way it works
- Mostly about IBM’s data and analytics tools
IBM Watson Analytics Pricing
| Plan | Price | Features |
|---|---|---|
| Essentials | $30 per user per month | Core planning and analytics capabilities |
| Standard | $60 per user per month | AI-driven business predictions and scenario planning |
| Premium | $120 per user per month | Advanced planning and analytics capabilities, including real-time data integration and predictive modeling |
4️⃣ Sisense
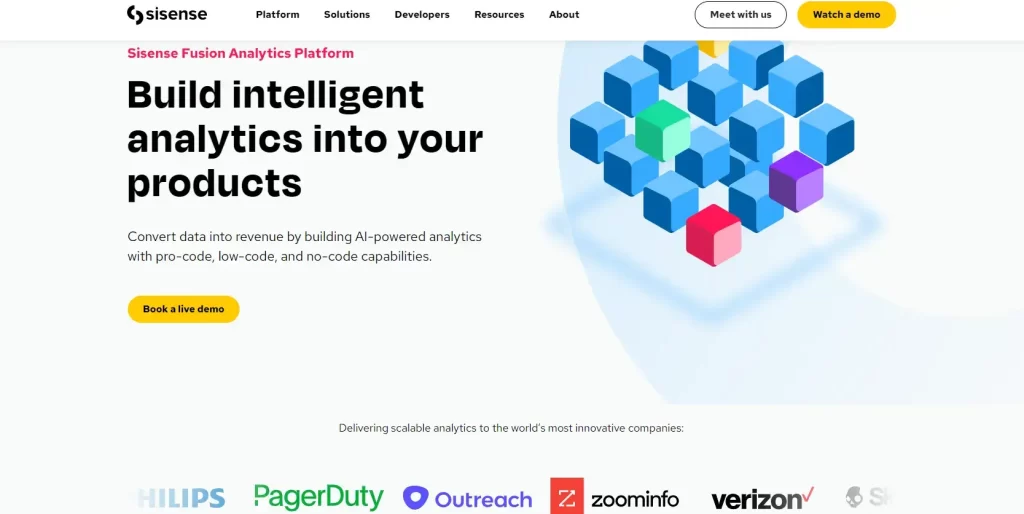
Sisense offers free trials and discounts that are tailored to your needs. Set up Sisense in the cloud or on-premises to use it for business data. This is one of Sisense’s plans:
Features of Sisense
- Strong built-in BI analytics features
- A pricing plan that is flexible and has low entry costs
- A lot of adapters and connections from third parties
- able to handle big and complicated information
- Using machine learning to find strange things
Limitations of Sisense
- Not as much focus on automated insights as rivals
- It takes longer to learn than easy drag-and-drop tools.
- Not enough ability to predict and plan
- Usually a more technical type of person.
Sisense Pricing
- Starter Plan: $200 per month, up to 500,000 events per month
- Basic Plan: $700 per month, up to 5 million events per month
- Advanced Package: $69,000, $138,000, or $207,000
- Pro Package: $109,000, $218,000, or $327,000
- Perpetual License: $4,200 per user
5️⃣ Microsoft Excel
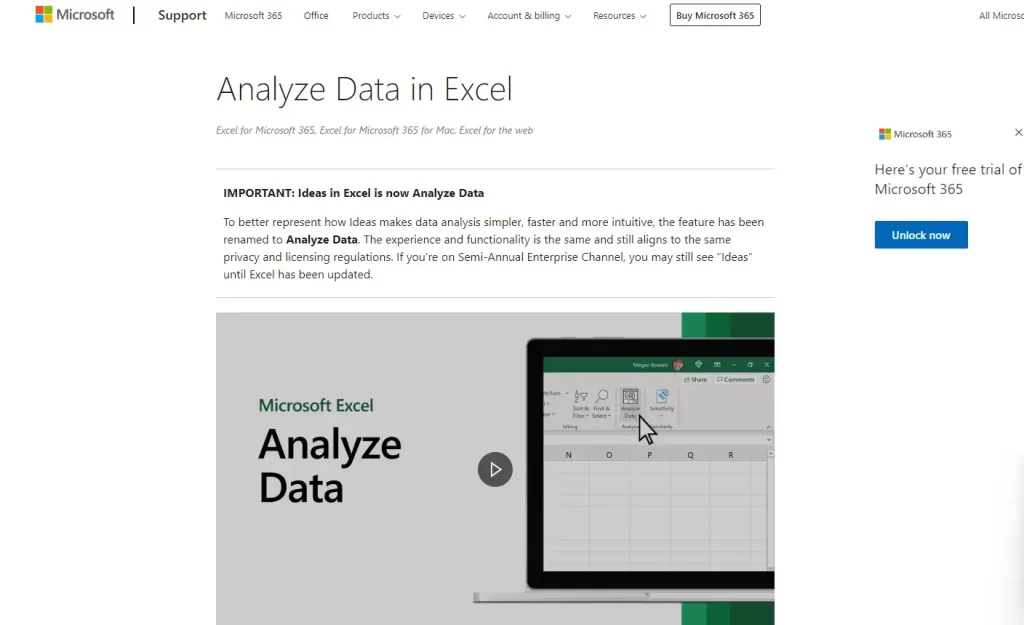
Microsoft Excel is still a flexible choice for data analysis and reports, even though it is one of the oldest and most popular business tools.
Excel wants to make it easy to look at data by adding new features that use artificial intelligence.
Features of Microsoft Excel
- Easy-to-use spreadsheet format to see, study, and share data insights
- Large datasets can be used, and it works well with other Microsoft systems.
- New automated observations and forecasts powered by AI
- Compared to other analytics tools, it’s easy for IT staff to get on board.
Limitations of Microsoft Excel
- Advanced data preparation and cleaning features lacking
- Not optimized for big data or real time analytics at scale
- Data visualization and dashboarding capabilities more limited than dedicated BI tools
- Power BI more enterprise-ready for cross-company data analytics
Microsoft Excel Pricing
| Purchase Option | Price | Features |
|---|---|---|
| Office 2021 Home & Student | $149.99 | One-time purchase for PC or Mac. Includes Excel, Word, PowerPoint, and OneNote. |
| Microsoft 365 Family | $99.99/year or $9.99/month | Subscription for up to 6 people. Includes Excel, Word, PowerPoint, OneNote, Outlook, OneDrive, and more. |
| Microsoft 365 Personal | $69.99/year or $6.99/month | Subscription for 1 person. Includes Excel, Word, PowerPoint, OneNote, Outlook, OneDrive, and more. |
| Excel for the web | Free | Web-based version with limited features. |
6️⃣ Qlik
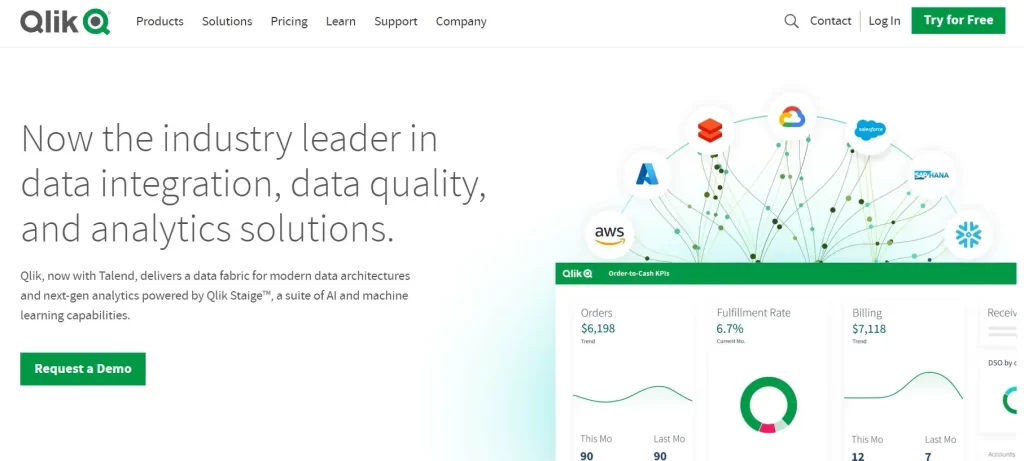
Qlik was one of the first companies to offer self-service business intelligence (BI) and data visualization. It gives business users live dashboards and analysis.
Qlik was the first company to offer self-service business intelligence, but it now meets the problem of being an innovator. It has been shown to be scalable for on-premise applications that focus on governance.
Features of Qlik
- Excellent for quick prototypes, drag-and-drop surroundings
- Using associative experience to find connections in data
- Big or complicated datasets can be handled by scalable on-premise design.
- User-driven BI and self-service analytics that are governed
- Strong skills in scenario planning and predictions
Limitations of Qlik
- Not as team-based as some newer cloud BI tools
- Outdated interfaces and problems with acceptance
- Not many options for preparing data
- Falls behind in ML and augmented analytics
Qlik Pricing
| Plan | Data for Analysis | Price |
|---|---|---|
| Standard | 50 GB | $20 user/month |
| Premium | 50 GB to 100 TB | $2,700/month |
| Enterprise | 500 GB to unlimited | Contact Qlik for pricing |
7️⃣ DataRobot

DataRobot has an AI tool for businesses that is meant to speed up predictive modeling, machine learning, and large-scale data analysis.
DataRobot is great at creating, deploying, and controlling machine learning models using automated AI. That being said, it lacks some tools for data prep and insights.
Features of DataRobot
- Fast, reliable models with automated machine learning
- Included best practices for feature building and modeling
- Models can be distributed easily across tools
- MLOps includes monitoring and control tools
- Choices for using outside data sources
Limitations of DataRobot
- Exclusive ways of modeling
- requires large amounts of info to work properly
- Predictive models get a lot of attention instead of business data
- Not as flexible for data experts with a lot of experience
DataRobot Pricing
| Plan | Price | Features |
|---|---|---|
| Solution | $65,000 | Customizable solution |
| DataRobot AI Cloud Platform for AWS | $98,000 | 12-month starter pack for 5 users |
8️⃣ KNIME
KNIME integrates machine learning and artificial intelligence capabilities across its data analytics platform.
KNIME makes advanced analytics easy to use by automating processes and letting you put together data visually. The modular pipeline method gives people of all skill levels a lot of options.
Features of KNIME
- You can pick from more than 200 machine learning methods.
- Automatic preprocessing of data and creation of features
- Model-building tools for everyday uses
- combines Python and R for more complex programming
- Connections for real-time deployment
Limitations of KNIME
- More code is needed for custom models
- It’s harder to understand complicated models.
- Lack of Automated Insights features
- A steep learning curve when you don’t use pre-built parts
KNIME Pricing
| Plan | Price | Features |
|---|---|---|
| Standard Edition | 62,500 euros per year | For small to medium-sized organizations |
| Enterprise Edition | 140,000 euros per year | For large enterprises with complex data needs |
| SaaS version | 250 euros per month | Cloud-based deployment option |
9️⃣ RapidMiner
RapidMiner provides an automated platform for creating and deploying predictive analytics and machine learning models to business users,
By leveraging automation, RapidMiner accelerates the creation, training, and use of predictive models. There is less self-service analytics with this option, though, compared to some others.
Features of RapidMiner AI
- The Auto Model tool makes the best models.
- Scores in real time for large-scale model placement
- More than 300 modeling methods and algorithms
- Integrated feature creation and data prep
- Explainable AI to make models clear
Limitations of RapidMiner AI
- Basic modification needs knowledge of coding
- emphasizing data science over live analysis
- Keeps old desktop interface parts
- A different RapidMiner Cloud is needed for scaling.
RapidMiner AI Pricing
| Plan | Price | Features |
|---|---|---|
| Professional | $7,500 per user per month | For small to medium-sized businesses |
| Enterprise | $15,000 per user per month | For large enterprises with complex data needs |
| AI Hub | $54,000 per user per month | For organizations that need to share data science models and insights with a large number of users |
| Free | $0 per user per month | Limited features |
What is the Relationship Between AI and Data Analysis?
Data analysis and artificial intelligence have a strong relationship. Data analysis techniques include looking for patterns, making predictions, identifying trends, and more.
For AI to train high-quality machine learning models, it needs a lot of data. AI systems are run by algorithms that can see more complex patterns in data than people can.
As data analysis techniques improve and files become larger and more thorough, AI systems become better at what they do and can do.
AI then gives us new ideas, tools, and ways to do our work with data analysis better. Automated machine learning speeds up the analysis and comprehension of large amounts of data.
AI skills like computer vision and natural language processing can show things that people might miss.
As a whole, better data analysis makes AI stronger, and AI makes data analysis more useful.
How AI Tools Are Transforming Data Analysis? Real-World Case Studies
Artificial intelligence (AI) is quickly transforming business analysis, allowing organizations to discover new insights, make better decisions, and increase operational efficiency.
Complex analysis that would be challenging or impossible for humans to carry out manually is being performed with the help of AI tools to automate repetitive operations like data cleansing and preparation.
Here are some real-world case studies of how AI tools are being used to transform data analysis:
Fraud Detection
In order to identify fraudulent conduct as it happens, financial institutions are utilizing AI tools.
One example is JPMorgan Chase, which employs a system driven by AI to sift through millions of transactions daily in search of signs of possible fraud.
Machine learning is used by the system to spot fraud-related patterns, such as out-of-the-ordinary expenditure or transactions from other countries.
Customer Segmentation
More specific consumer subsets are being identified by retailers through the use of AI tools.
As an example, Amazon classifies customers into several groups according to their demographics, online activity, and purchase history using AI.
Customers are then targeted with individualized marketing campaigns and product suggestions based on this information.
Predictive Maintenance
In order to foresee potential equipment breakdowns, industrial organizations are utilizing AI-powered tools.
To anticipate when components of its aircraft engines may fail, GE Aviation, for instance, analyses data collected by sensors and employs AI.
In order to avoid expensive downtime and safety risks, this data is subsequently used to plan maintenance downtime.
Risk assessment
Artificial intelligence (AI) tools are being used by insurance companies to evaluate the potential risk of claims.
To assess the likelihood of an accident, Progressive Insurance, for instance, use AI to sift through client data including driving records and car types. Payment plans are based on this data.
Medical diagnosis
In order to make more precise diagnoses, healthcare providers are utilizing AI tools.
One application that employs AI to detect cancer is IBM Watson for Oncology, which examines X-rays and CT scans among other medical pictures.
Decisions about treatment can then be based on this data.
Conclusion
At last, we’ve talked about all the essential elements of using Best AI tools for data analysis.
We talked about what AI data analysis is and how these tools can be used to find new information, make tasks easier, and work more efficiently.
We also gave you a guide on how to pick the right AI tools for your needs based on your data and goals.
Lastly, we looked at some of the best AI platforms, such as Tableau, Power BI, Watson Analytics, and others.
We also looked at real-life examples of how companies are using these platforms to do things like find scams, do predictive maintenance, and make medical diagnoses.
In conclusion, AI is truly revolutionizing data analysis, leading to quicker and more intelligent decision-making.
AI tools can help find value in data at a scale previously unattainable with the right approach.
